
Life Timeline and Life in Weeks
See a whole day across work, rest, family and health, then zoom out to every week of your life lived and still ahead.
These images are illustrations of the concept, not screenshots of the actual product.
Overview
Life Timeline and Life in Weeks is a TimeCampus concept for looking at time beyond the workday. Work accounts for roughly a third of a person's hours, yet most time tools stop at the office door, and the rest of the day, from sleep and commuting to waiting, exercise, family and leisure, goes unmeasured. The design extends the product's timeline to the whole day and then to the whole of a life, framed by a question the product returns to often: what if today was your last?
The Life Timeline presents one day as a vertical sequence of color-coded blocks, each aligned to a time range on the left. A summary bar at the top totals the day into work, personal and sleep time. Blocks are labeled by life domain, including sleep, commute, deep work, lunch, meeting, waiting, health and gym, family and leisure, and each carries tags describing where the entry came from, such as a wearable, GPS location, a code editor or the calendar, together with details like distance, a focus percentage, duration or workout effort. Waiting appears as its own block rather than disappearing inside a commute, which makes time nobody chose visible.
Your Life in Weeks zooms out to a memento-style grid. Each row is a year of age and each of its fifty-two cells is a week. Filled cells mark weeks already lived, outlined cells mark weeks ahead, and a Now marker highlights the current week. A side card states how many weeks have been lived, how many remain if one lives to a chosen age, and the years lived and remaining, then closes with a short reflection: make this week count.
The two views are designed to work together. The day shows where hours actually went, and the grid makes their scarcity concrete. They connect to the product's values, goals and life balance features and to its time well spent score, which judge a day by alignment with what a person values rather than by output. Personal context of this kind is meant to stay private to the individual. All times, figures and names in the illustrations are sample data.
What this concept shows
- Whole-day timeline of color-coded blocks aligned to time ranges from early morning to midnight
- Daily summary totaling work, personal and sleep time
- Life-domain categories including sleep, commute, deep work, meetings, waiting, health, family and leisure
- Source tags on each block, such as wearable, GPS, code editor or calendar, with duration, distance or focus details
- Waiting and travel time shown as its own block so unchosen time is visible
- Life-in-weeks grid with one row per year of age and fifty-two week cells per row
- Filled cells for weeks lived, outlined cells for weeks remaining and a Now marker on the current week
- Summary card with weeks lived, weeks remaining to a chosen age and a make-this-week-count reflection
How it works
- Open Life Timeline to see today's summary of work, personal and sleep time.
- Scan the day's blocks from morning to midnight, checking each life domain and where its data came from.
- Notice unchosen time such as commutes and waiting alongside deep work, family and leisure.
- Switch to the Life Grid to see every week lived and remaining, with the current week marked.
- Read the weeks-lived and weeks-remaining summary and decide what this week should include.
Who it's for
- Individuals reflecting on how they spend their time
- Knowledge workers balancing work and personal life
- People working toward personal goals and the coaches who support them
- Anyone building healthier daily routines
Illustrations
2 illustrations of this concept. Select one to view it full size.
Whole-Day Life Timeline
This illustration shows the Life Timeline page of a desktop web app, with a left navigation for Dashboard, Life Timeline, Goals, Insights, Settings and Profile. A summary bar at the top totals the day into work, personal and sleep time, and the date sits at the right. The day runs down the page as a column of full-width, color-coded blocks, each paired with a time range on the left: sleep, a morning commute, a deep work session, lunch, another commute, a team meeting, a waiting period during travel, a second deep work block for code review, the commute home, a gym session, family dinner, an evening of reading and a film, and sleep again. Tags at the right of each block show the source and detail, such as a wearable, GPS distance, a focus percentage, the calendar, calories and heart rate. Times and values are sample data.
Your Life in Weeks Grid
This illustration shows the Your Life in Weeks page, reached from a Life Grid item in a compact sidebar that also links to Dashboard, Timeline, Goals and Settings. The page is dominated by a grid with age down the left axis and the weeks of the year, one to fifty-two, across the top and bottom. Filled teal cells represent weeks already lived and outlined cells represent weeks still ahead; the current age is highlighted on the axis, and a Now tooltip points to the current week and its number. A glass card to the right states how many weeks have been lived, how many remain if one lives to ninety, and the years lived and remaining, then closes by asking what if today was your last and encouraging the reader to make this week count. A search field accepts weeks and events. The figures are sample data.
Topics
- life timeline app
- life in weeks
- memento mori calendar
- your life in weeks grid
- work life balance tracker
- whole day time tracking
- personal time tracking
- where does my time go
- life domains time tracking
- finite life visualization
Related concepts
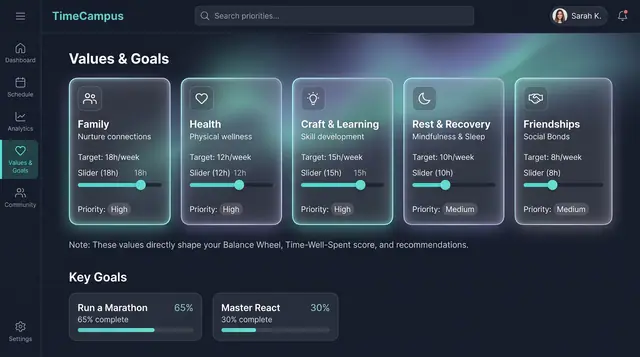
Values, Goals and Life Balance
Declare what matters and the weekly balance you want, then see how your real week compares, on desktop or phone.
3 illustrations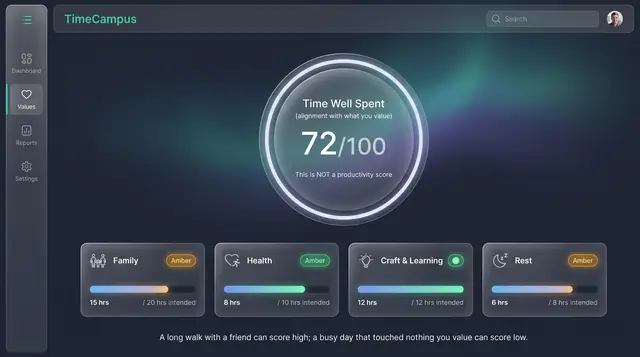
Time Well Spent Score
An alignment score that measures how closely your week matched what you value, not how much you produced.
2 illustrations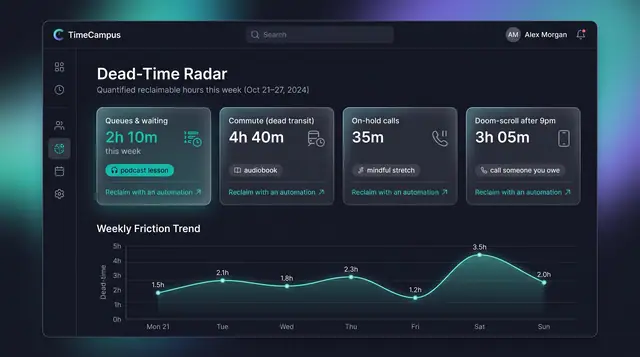
Dead-Time Radar
Quantify the hours you never chose, from queues and dead transit to late-night scrolling, and see how to take them back.
2 illustrations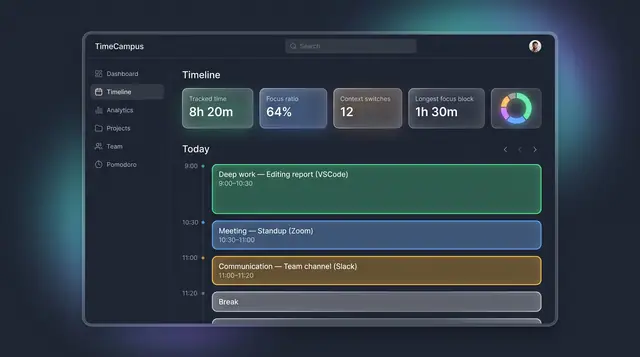
The Self-Assembling Timeline
Your day, assembled from every source into categorized blocks, with suggested projects you can accept or reject.
3 illustrations