
Meeting Cost and Load
See what every meeting costs in hours and money, rate its value, and watch weekly meeting load before it crowds out focus.
These images are illustrations of the concept, not screenshots of the actual product.
Overview
Meeting Cost and Load is a TimeCampus concept for treating meeting time as a resource with a visible price. Meetings are one of the largest and least examined uses of a team's week: they are easy to schedule, hard to decline and rarely measured against what they produce. The design puts an estimated cost, a duration, a participant count and a value rating on every meeting, then rolls those figures up into a weekly view of meeting load.
The illustrated experience starts with a Meetings list for a chosen week. Each meeting is a card showing its title, time slot and length, an estimated cost, an average star rating, the participant avatars and a type tag such as strategy, design, client or team sync. A search box and a filter control narrow the list, and an Add Meeting button sits beneath it. Opening a meeting leads to a detail view linked to its calendar event, with attendance grouped into attending, tentative and declined, a numbered agenda, a notes summary and a checklist of action items assigned to named participants. A Meeting Value and Insights panel shows the estimated cost based on attendance and rates, the attendee count, an engagement percentage and a five-star control for rating the meeting's value.
The Meeting Load Awareness dashboard steps back to the whole week. It reports total meeting hours against a personal weekly limit along with the change from the previous week, a true cost of meetings split between internal and client time, a six-week trend of meeting hours, and a breakdown by meeting type (standups, client calls, project syncs, one-on-ones and other) in hours and share of the total. All figures in the illustrations are sample data.
In the wider product, the concept draws on the same calendar signal that feeds the self-assembling timeline, and the same cost logic appears in aggregate on the team analytics view. It is designed to inform decisions, such as shortening a recurring sync, dropping a low-rated meeting or protecting focus hours, rather than to police attendance.
What this concept shows
- Meeting cards with time slot, duration, estimated cost, average rating, participants and a type tag
- Search and filter controls across a week of meetings, with an Add Meeting action
- Calendar-linked meeting detail with attending, tentative and declined participants
- Agenda, notes summary and assignable action items with completion checkboxes
- Meeting value panel with estimated cost based on attendance and rates, engagement and a five-star value rating
- Weekly meeting hours measured against a personal load limit, with week-over-week change
- True cost of meetings split into internal and client time
- Six-week meeting load trend and a breakdown of hours by meeting type
How it works
- Open Meetings to see the week's meetings as cards with cost, duration, rating and participants.
- Search or filter the list, or add a meeting with the Add Meeting button.
- Open a meeting to review who attended, the agenda, the notes and the action items.
- Check the estimated cost and engagement, then rate the meeting's value.
- Switch to Meeting Load Awareness to compare this week's meeting hours and cost with your limit and recent weeks.
- Use the meeting type breakdown to decide which recurring meetings to shorten, merge or drop.
Who it's for
- Team leads and engineering managers
- Project and product managers
- Individual contributors protecting focus time
- Agency and consulting leads tracking client meeting time
- Operations and finance leads reviewing the cost of collaboration
Illustrations
3 illustrations of this concept. Select one to view it full size.
Meetings List with Cost and Rating
This illustration shows the Meetings page of a desktop web app, with a left navigation for Dashboard, Meetings, Calendar, Teams, Reports and Settings. The header names the page and the week being viewed, with a search box and a filter button on the right. The body is a stack of meeting cards. Each card lists the meeting title, date, start and end time and total duration, followed by an estimated cost figure, a star rating with its average score, a participant count with overlapping avatars and an overflow count, and a tag for the meeting type, such as strategy, design, client or team sync. An Add Meeting button sits below the list, and a narrow right rail holds a small bar-chart summary. The costs, ratings and names are sample data; the design demonstrates how placing a price and a quality score beside each meeting makes a week of meetings comparable at a glance.
Calendar-Linked Meeting Detail
This illustration opens a single meeting in detail. The title, date and time range sit at the top, beside a badge showing that the meeting is linked to an external calendar and kept in sync. A participants row shows avatars and groups people into attending, tentative and declined chips. Below, three glass cards hold a numbered agenda, a short notes summary of the discussion, and an action items checklist in which each item has an owner and a checkbox, one already ticked. A Meeting Details and Metrics card records the duration. On the right, a Meeting Value and Insights panel shows an estimated cost based on attendance and rates, the attendee count and an engagement percentage, with a five-star control for rating the meeting's value. A compact icon sidebar links to Dashboard, Calendar, Meetings, Tasks, Insights and Team. All values shown are sample data.
Meeting Load Awareness Dashboard
This illustration shows the Meeting Load Awareness dashboard for a selected week, chosen from a date-range picker in the top right. Four cards divide the page. Total Meeting Hours This Week gives the week's meeting time, the share of a personal maximum load it represents, and an up arrow with the change from the previous week. True Cost of Meetings gives an estimated productivity cost and splits it into internal and client meetings, each with its hours. Meeting Load Trend plots meeting hours across the past six weeks as a smooth area chart, with a callout on the latest point. Meeting Type Breakdown uses horizontal bars to compare standups, client calls, project syncs, one-on-ones and other meetings, each labeled with hours and a percentage. The figures are sample data; the design shows how meeting load and cost can be followed as a trend rather than guessed.
Topics
- meeting cost calculator
- true cost of meetings
- meeting load tracking
- meeting analytics
- meeting value rating
- calendar meeting insights
- reduce meeting overload
- meeting hours per week
- meeting notes and action items
- meeting time tracking
Related concepts
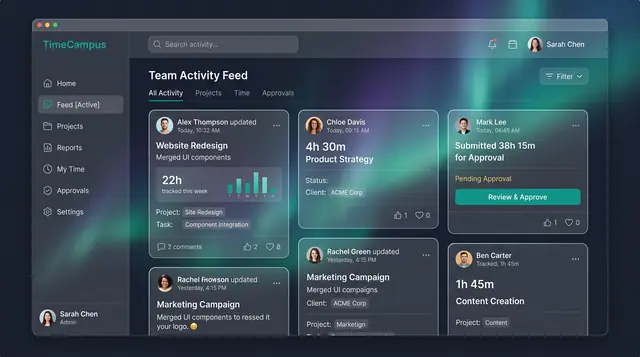
Team Activity and Capacity Planning
Follow what the team is working on, read aggregate time and meeting load, and plan allocations week by week against real capacity.
3 illustrations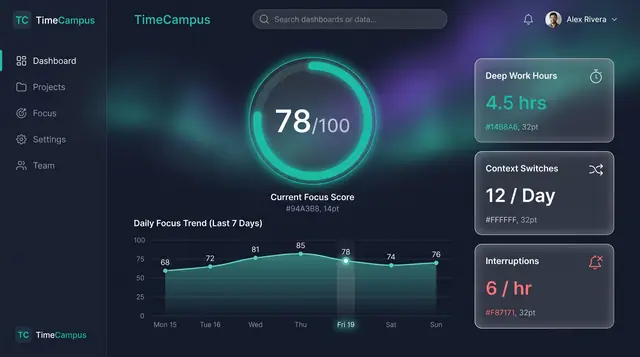
Focus Score and Work Patterns
A single focus score, the deep-work and interruption figures behind it, and the weekly rhythm that explains both.
2 illustrations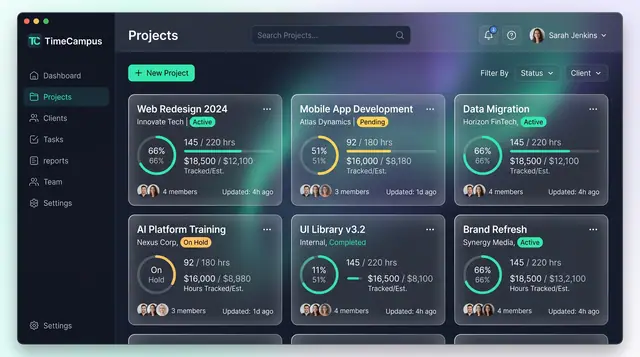
Projects and Tasks
Projects, budgets and task lists tied to the hours actually spent, so progress and burn are read from the same record.
3 illustrations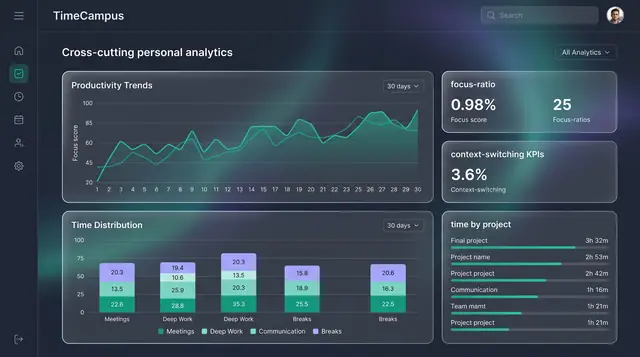
Personal Analytics and Reports
Turn captured time into trends, time distribution and project totals, then export the findings as ready-made reports.
2 illustrations